
Period and granularity
A timezone-aware period picker controls the range, and your choice persists as you move between pages. The time bucket scales with the range:| Range | Bucket |
|---|---|
| Up to 1 hour | 1 minute |
| Up to 1 day | 15 minutes |
| Up to 7 days | 6 hours |
| Up to 30 days | 12 hours |
| Over 30 days | 1 day |
Overview
The overview shows headline KPIs, each with a period-over-period trend:| KPI | What it shows |
|---|---|
| Total requests | Requests in the period. |
| Errors and error rate | Responses with a 4xx or 5xx status, and that count as a percentage of total requests. |
| Latency (p50 / p95 / p99) | Median, 95th, and 99th percentile response time. |
| Credits consumed | Credits used in the period. |
Per-API breakdown
For each API, see latency (p50 / p90 / p99) and request and error counts. Use it to find which API drives your traffic, errors, or latency.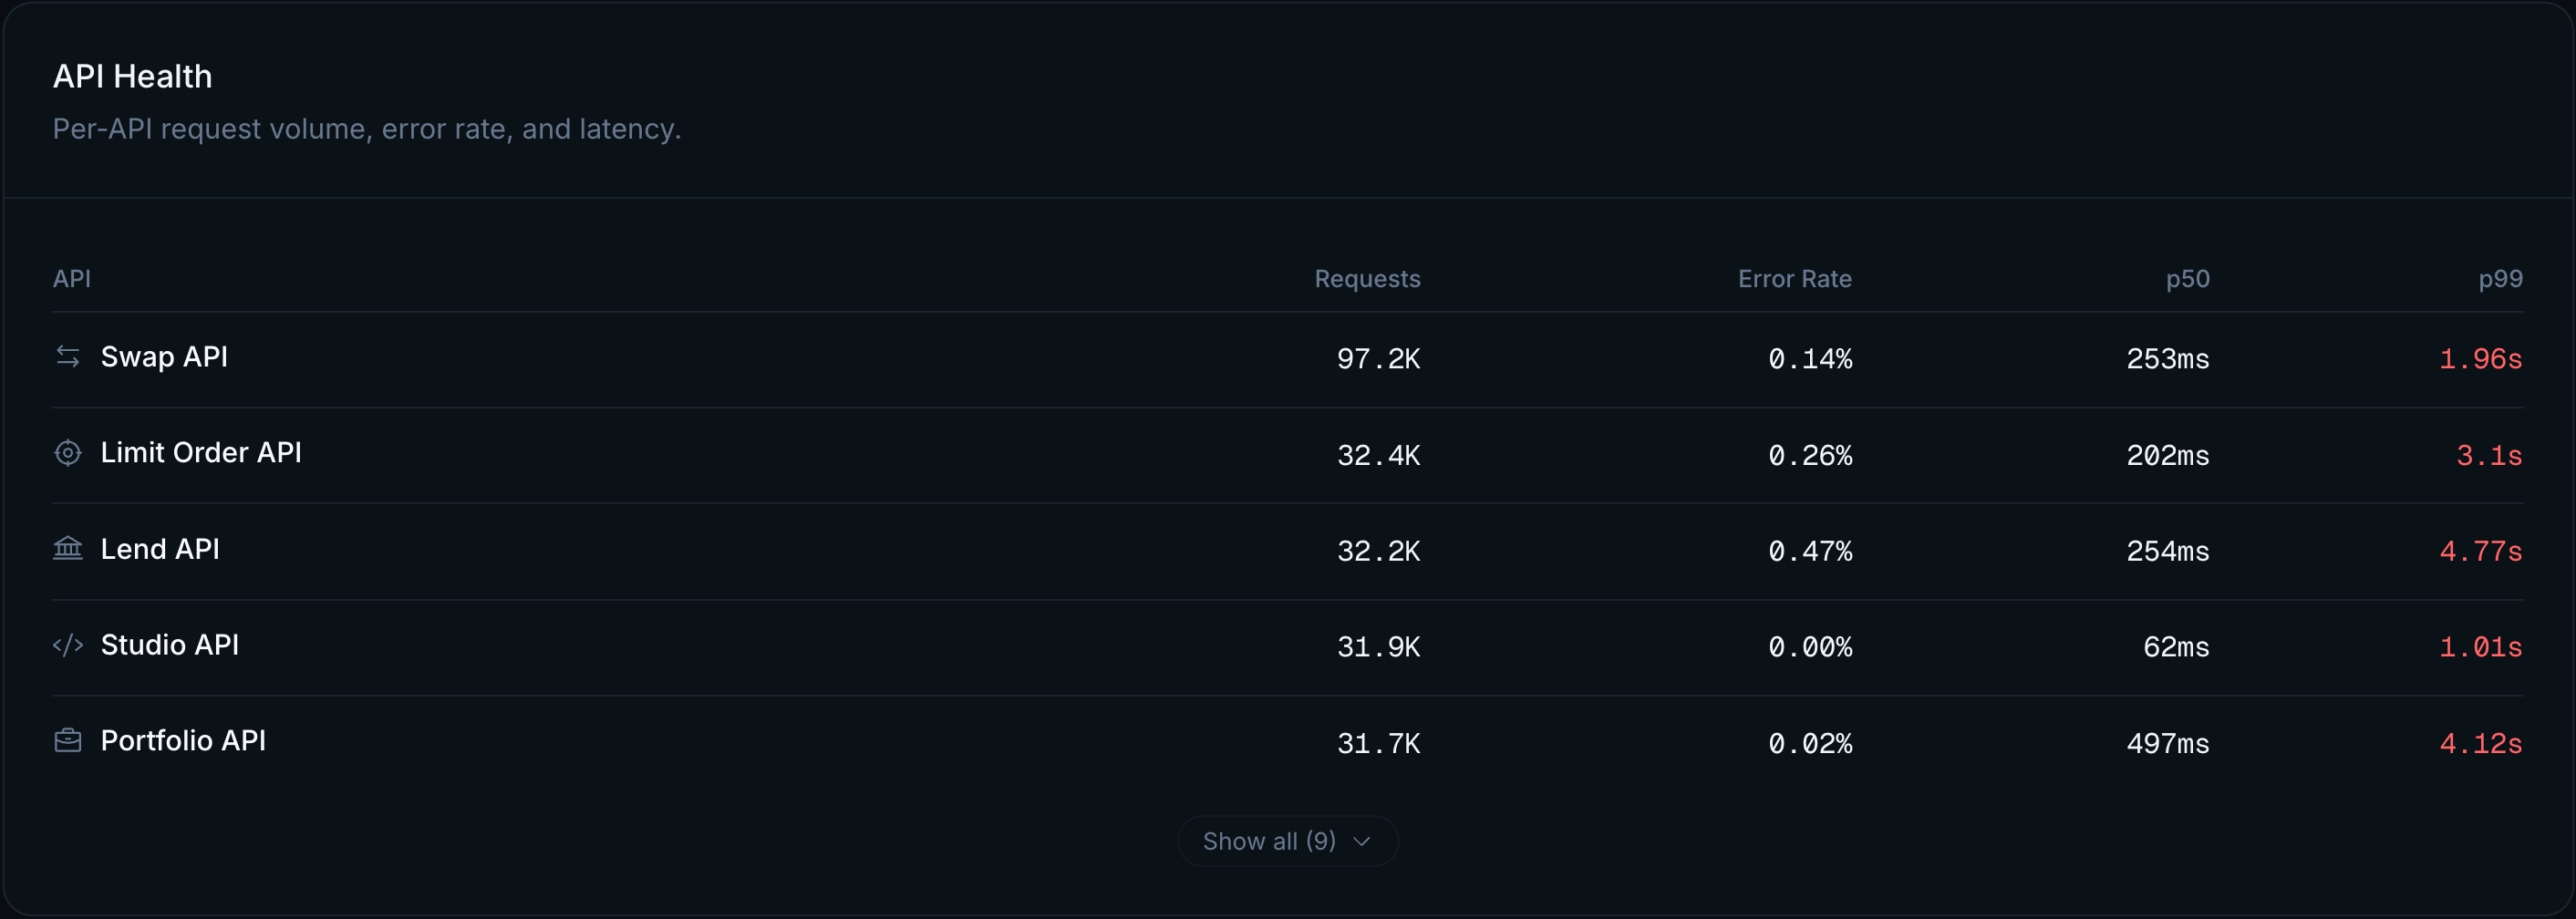
API-specific analytics
Some APIs have deeper analytics beyond the overview. Common metrics include volume, success rate, latency by phase, top token pairs, and fees collected.Firewall analytics
Firewall analytics show rule outcomes over time and how often each rule matched. See Firewall for the rules behind them.Related
Request Logs
Drill from a trend into the individual requests behind it.
Firewall
The rules behind firewall analytics.
Plans and Pricing
How credits map to cost.
Rate Limits
The limits your request volume runs against.